October 2026 North Texas Housing Market Update: Collin, Denton & Grayson Counties

October 1, 2026

Collin, Denton, and
Grayson Counties by Price Range

Where did all the buyers go?


That may sound dramatic, but the pending-sale numbers are hard to ignore.

Across every price range we track in Collin, Denton, and Grayson counties, fewer homes went under contract than during the same period last year.


Does that mean buyers have disappeared? Not exactly.


Some price ranges still have relatively limited inventory. Others are giving buyers considerably more choices. In a few categories, the homes that did sell actually moved faster than they did a year ago.


The more interesting story may be that buyers are becoming more selective about which homes are worth saying yes to.


That matters whether you are buying or selling.


If you are a seller, fewer competing listings may sound encouraging—but what if buyer activity has fallen even faster?


If you are a buyer, more inventory may create opportunity—but is the property really a good value once you consider condition, repairs, taxes, insurance, incentives, and monthly payment?


That is why broad labels such as “buyer’s market,” “seller’s market,” or even “slow market” rarely tell you enough.


The more useful question is: What is happening with homes like yours, in your price range, in the area where you actually want to buy or sell?


The charts below use the most recent completed monthly MLS data available through North Texas Real Estate Information Systems, Inc. (NTREIS), covering September 2026 and available as of October 1, 2026, with year-over-year percentage comparisons.


Closed sales reflect contracts negotiated several weeks earlier. Pending sales give us a more current look at what buyers are choosing now—which makes them especially important this month.

Collin County
Market Update by Price Range
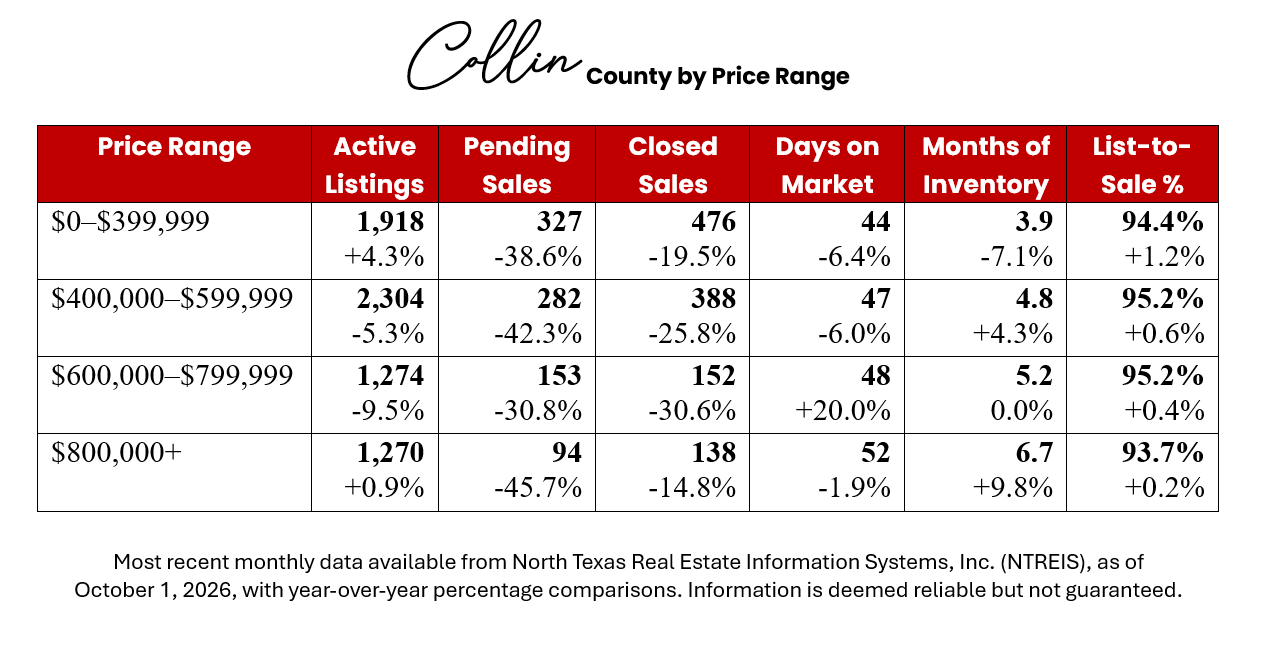
Homes Priced Under $400,000

This is one of the most noticeable changes from last month.


In our previous update, Collin County homes under $400,000 stood out because pending sales were up 8.4% from the year before and inventory had tightened to 3.7 months.


Now, pending sales are down 38.6% year over year.


Closed sales are down 19.5%, while active listings are up only 4.3%. At the same time, months of inventory remains relatively contained at 3.9, and homes that sold averaged 44 days on market—6.4% faster than a year ago. 


So did this market suddenly go from strong to weak?


I would be careful making that conclusion.

What the numbers do tell us is that significantly fewer buyers are committing to purchases, even though supply has not suddenly exploded.


Imagine two homes priced at $385,000. One is well maintained, reasonably updated, and priced in line with recent sales. The other needs a roof, flooring, HVAC work, and several cosmetic improvements.


Technically, both are “under $400,000.”

To the buyer calculating what the home will actually cost after closing, they may not feel comparable at all.


What to watch: If pending activity remains weak while inventory stays relatively tight, this could become one of the clearest examples of buyers refusing to purchase simply because a home falls within a more affordable price range.

Homes Priced $400,000–$599,999

At first glance, sellers might like one statistic here: active listings are down 5.3% from last year.


Fewer homes to compete against should help, right?


Maybe—but only if enough buyers are still shopping.


Pending sales fell 42.3%, considerably faster than the decline in available listings. Closed sales were also down 25.8%, while months of inventory increased to 4.8. 


Suppose there were eight competing homes last year and only five today.


That sounds promising for a seller.


But what if there were three serious buyers last year and only one today?


Suddenly, having fewer competing listings does not feel like much of an advantage.


That is why I would not look at declining active inventory by itself and assume sellers have gained leverage.


What to watch: The important number here may not be how many homes are listed. It may be how many of those homes are actually convincing buyers to move forward.

Homes Priced $600,000–$799,999

This range raises a different concern: time.


Active listings declined 9.5%, yet pending sales were down 30.8% and closed sales fell 30.6%. Homes that sold averaged 48 days on market, up 20% from last year, while inventory remained at 5.2 months. 


Five months of inventory is not an overwhelming amount.


But buyers are taking longer.


What happens if a seller starts a little high thinking, “We can always reduce it later”?

In a faster market, that may be easier to recover from.


When buyers are already taking more time to commit, those first several weeks can matter. By the time the price is corrected, the buyer may be comparing the property with newer listings, another community, or new construction offering incentives.


And that is where sellers sometimes underestimate the competition.


The competition may not be the house two streets away.


It may be everything else a buyer can purchase for roughly the same monthly payment.


What to watch: In this range, positioning correctly from the beginning may matter more than simply having fewer active listings than last year.

Homes Priced $800,000 and Above

This is where Collin County buyers have the most breathing room.


Active listings are essentially flat, up just 0.9%, but pending sales fell 45.7%. Inventory increased 9.8% to 6.7 months, the highest of Collin County’s four price ranges. The average list-to-sale percentage was 93.7%. 


At this price point, being a “nice house” may not be enough.


A buyer spending $850,000, $950,000, or more may be comparing lot size, renovations, floor plan, outdoor living, taxes, amenities, school district, location, new construction, and what they would still want to change after closing.


What if your home is beautifully maintained, but another property five minutes away already has the pool, remodeled kitchen, or larger lot that buyer wants?


With more inventory, buyers can be choosier about those differences.


What to watch: The question becomes less about whether the home is good and more about whether it gives the buyer a compelling reason to choose it over the alternatives.

Denton County
Market Update by Price Range
Homes Priced Under $400,000

Denton County’s lower-priced market is worth comparing with last month because the slowdown has become more noticeable.


In the previous report, pending sales were down only 5.8% year over year, homes averaged 36 days on market, and inventory stood at 3.9 months.


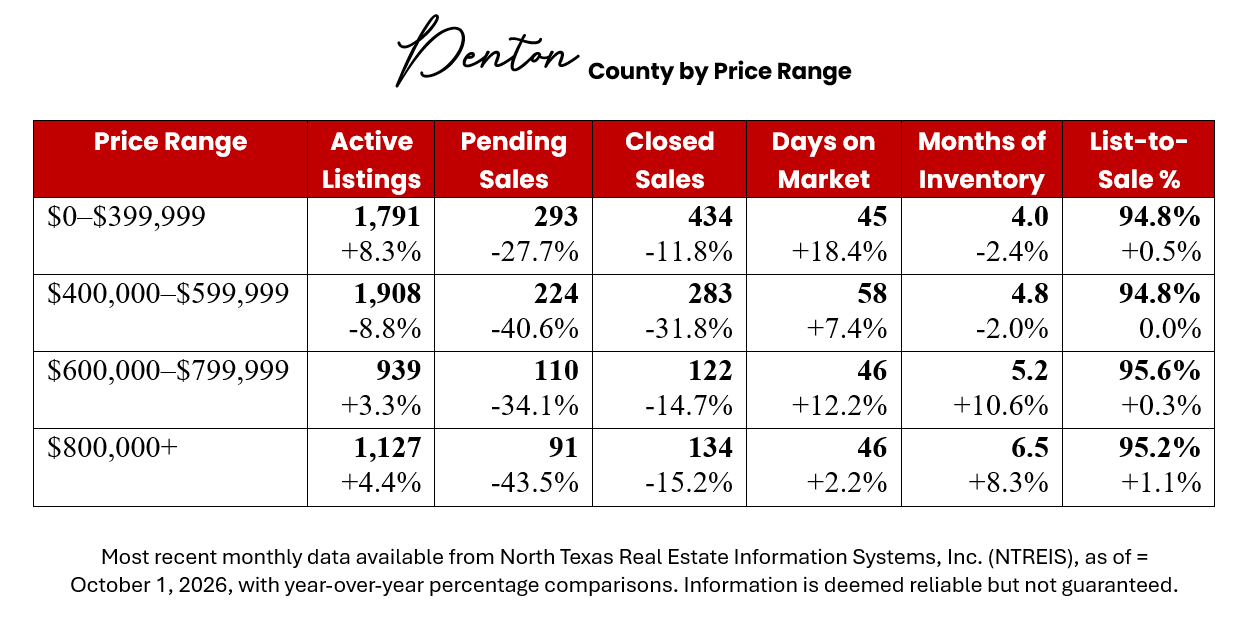
Now pending sales are down 27.7%, days on market have increased to 45, and inventory is at 4.0 months. Active listings are also up 8.3%. 


That does not mean buyers suddenly have unlimited leverage.


Four months of inventory is still very different from the much higher supply levels we are seeing in parts of Grayson County.


But buyers do appear to have more time to compare.


And at this price point, comparison should go beyond countertops and paint colors.


A $350,000 home with a newer roof, HVAC system, and windows can be a very different financial decision from another $350,000 home where those expenses may be waiting shortly after closing.


The listing price may be identical.


The ownership cost may not be.


What to watch: Buyers have a little more room to slow down, which makes condition and near-term repair costs even harder for sellers to ignore.

Homes Priced $400,000–$599,999

This range gives us a useful lesson about which listings may tell us the most.


Active listings declined 8.8%.


But pending sales fell 40.6%, closed sales were down 31.8%, and homes averaged 58 days on market. 


If you are a seller, which properties deserve the most attention?


The ones that are still sitting on the market?


Or the ones buyers actually chose?


An active listing tells us what another seller hopes to get.


A pending listing tells us that a buyer finally said yes.


We do not yet know the final price or concessions on a pending property, but it can still reveal which combinations of price, condition, location, and features are earning buyer attention.


What to watch: When buyer activity slows, pending properties can sometimes tell us more about today’s buyer than a long list of homes that remain available.

Homes Priced $600,000–$799,999

This is where one statistic could easily give the wrong impression.


Pending sales declined 34.1%, active listings increased 3.3%, days on market rose to 46, and inventory increased 10.6% to 5.2 months.


Yet the average list-to-sale percentage was still 95.6%. 


Does 95.6% mean sellers are refusing to negotiate?


Not necessarily.


Imagine a property originally listed at $700,000. After spending time on the market, the seller reduces it to $675,000. The eventual buyer negotiates a price fairly close to that new asking price.


The final list-to-sale percentage may still look strong even though a meaningful adjustment occurred before the offer was written.


And that percentage tells us nothing about closing-cost assistance, repairs, or rate buydowns.


What to watch: The negotiation may be happening somewhere the final list-to-sale percentage cannot show us.

Homes Priced $800,000 and Above

At higher price points, sellers may need to think about competition differently.


Denton County active listings increased 4.4% in this range, pending sales declined 43.5%, and inventory rose 8.3% to 6.5 months.


Suppose your home is in Frisco.


Is the competition only another home in the same subdivision?


Probably not.


A buyer at this price may also be looking elsewhere in Frisco, in Prosper, Celina, or at new construction with builder incentives.


The buyer’s search area may be much broader than the seller’s definition of the neighborhood market.


That matters even more when buyers have additional choices and less reason to compromise.


What to watch: Sellers should ask not only, “What are homes near me listed for?” but also, “What else could this buyer purchase with the same budget?”

Grayson County
Market Update by Price Range
Homes Priced Under $250,000

This range has changed noticeably since last month.


In the previous report, closed sales were up 27.9% from the year before, even though pending sales were already beginning to weaken at -18.0%.


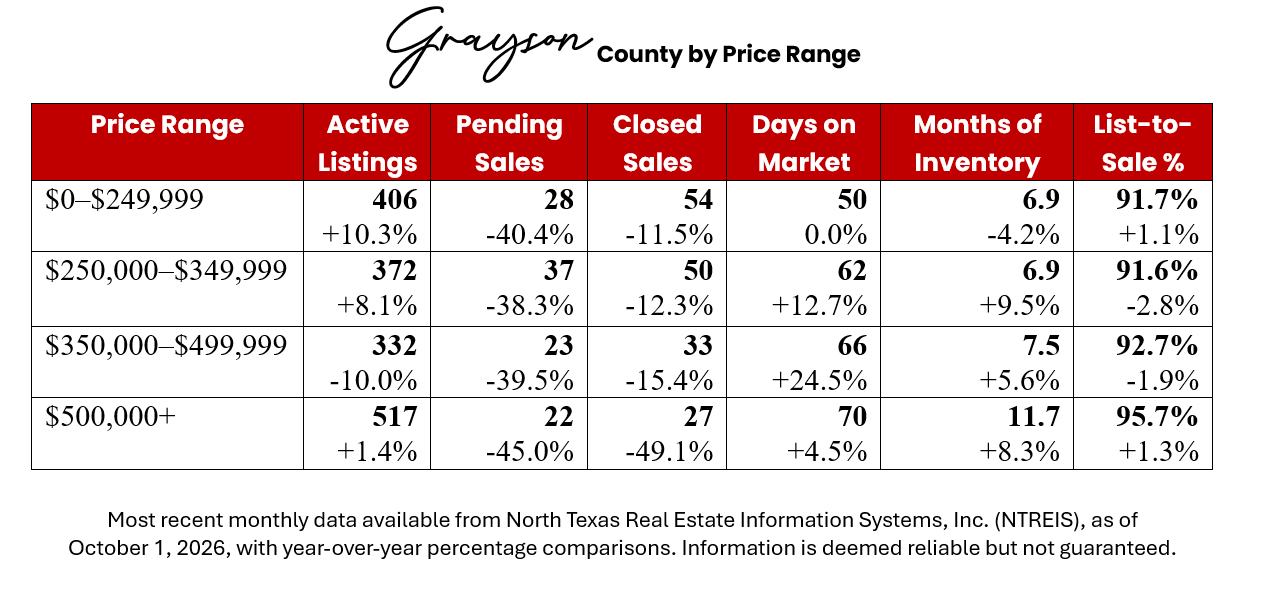
Now pending sales are down 40.4%, and closed sales have moved to a decline of 11.5%. Inventory has increased from 6.5 months in the previous report to 6.9 months now.


That is an important shift.


Last month’s strong closing number was telling us about contracts negotiated earlier. The weaker pending number was already giving us a clue about what might come next.


Now the closed-sales number is beginning to reflect that slower activity.


For buyers, lower price does not automatically mean lower risk.


What happens if the home needs foundation work, a septic repair, electrical updates, an HVAC replacement, or a roof shortly after closing?


The apparent bargain can disappear quickly.


What to watch: This is a good example of why pending sales can be worth watching before the change becomes obvious in closed sales.

Homes Priced $250,000–$349,999

This range offers a different kind of opportunity: more ways to negotiate.


Active listings increased 8.1%, pending sales declined 38.3%, homes averaged 62 days on market, inventory increased to 6.9 months, and the average list-to-sale percentage fell to 91.6%. 


But negotiating does not always mean asking for the biggest possible price reduction.


What if the buyer is comfortable with the payment but wants to preserve cash at closing?


Closing-cost assistance may be more valuable.


What if monthly payment is the bigger concern?


Depending on the financing, money toward a rate buydown may accomplish more than the same amount taken off the price.


The best negotiation depends on what problem you are actually trying to solve.


What to watch: When there is more negotiating room, the strongest deal may not be the one with the lowest sales price. The terms matter too.

Homes Priced $350,000–$499,999

This is one of the clearest examples of why active-listing counts can fool you.


Active listings fell 10%.


That sounds encouraging for sellers.


But pending sales declined 39.5%, homes averaged 66 days on market, and months of inventory increased 5.6% to 7.5. 


How can there be fewer homes available but more months of inventory?


Because months of inventory is not simply a count of homes for sale. It compares the amount of supply with the current pace of sales.


Imagine a store reduces the amount of merchandise on its shelves by 10%, but the number of customers purchasing that merchandise falls much more sharply.


The shelves can still take longer to clear.


Housing inventory works in a similar way.


What to watch: A declining number of active listings does not automatically mean competition is improving for sellers if buyers are pulling back even faster.

Homes Priced $500,000 and Above

Unlike several other categories, the story here has not really changed.


And that is exactly why it deserves attention.


Last month, Grayson County’s $500,000+ market had 11.5 months of inventory.


It now has 11.7 months.


There are 517 active listings and only 22 pending sales. Pending activity is down 45%, closed sales are down 49.1%, and homes that sold averaged 70 days on market.


This is not a one-month spike in inventory that has already begun correcting itself.


So far, the supply issue is persisting.


Now imagine you are the buyer.


Instead of choosing between three reasonable options, you may have ten.


Would you overlook the awkward floor plan? The deferred maintenance? The location you are unsure about? The price that feels a little ambitious?


Probably not as easily.


Interestingly, the average list-to-sale percentage was still 95.7%.


That does not erase the inventory problem. It simply reminds us that list-to-sale percentage cannot show previous reductions or other concessions that may have helped make the transaction work.


What to watch: With nearly a year of inventory at the current sales pace, waiting patiently is not much of a marketing strategy by itself. The property needs a clear reason to become the buyer’s choice.

What Changed Since Last Month?

Some changes happen quickly.


Others become important because they do not change.


Collin County under $400,000 is the clearest example of the first.


Pending sales went from being up 8.4% year over year in the previous report to down 38.6% now, while inventory stayed relatively tight.


Grayson County at $500,000 and above is the opposite.


Inventory moved only slightly, from 11.5 months to 11.7 months.


That tells us the challenge there is persisting rather than appearing suddenly.


And Grayson County under $250,000 gives us another useful lesson.


Last month, closed sales still looked strong while pending sales had already started weakening. Now both measures have moved lower.


That is why we pay attention to more than one statistic—and why pending activity can sometimes tell us where the market is heading before closed sales catch up.

What the Three
Counties Reveal Together

If there is one word I would use to describe the current market, it is selective.


Not absent. Not desperate. Not universally in control. Selective.


A seller with a well-maintained home in a price range with limited inventory should not use the same strategy as a seller competing in a segment with seven, nine, or nearly twelve months of supply.


The same is true for buyers. A home that is priced well, shows beautifully, and has little direct competition may require a very different approach from one sitting in a price range with months of available inventory and several comparable choices.


So the question is not simply:

“What is the North Texas market doing?”


It is:

“What is the market doing around this particular property?”


That is where the useful answer begins.


The same caution applies when looking at list-to-sale percentages. A home may sell close to its final list price after earlier reductions, or the seller may contribute toward closing costs, repairs, an interest-rate buydown, a home warranty, or other negotiated expenses. A 95% or 96% list-to-sale ratio does not automatically mean buyers had little negotiating room.


Sometimes the negotiation happened before the contract. Sometimes it happened elsewhere in the contract. And sometimes the home was positioned well enough that the buyer simply did not need to push very far.


Context matters.


County statistics can help us understand direction, but they cannot tell us exactly what an individual home should be priced at.


For that, we need to know what buyers are actually choosing in the neighborhood and price range. Which homes are going pending? Which ones are sitting? Where are price reductions happening? How does the condition compare? Are nearby builders offering incentives?


And perhaps the most important question for a seller is:

If a buyer has several reasonable choices, why would they choose yours?

We can give you an honest, property-specific look at your home—where it is likely to compete well, where buyers may push back, and whether there are issues worth addressing before you put it on the market.


And if you are not ready to make a move, that is okay too.


Sometimes the smartest decision is to watch before acting.


We can set up a Neighborhood Market Watch so you can follow new listings, price changes, pending sales, and recent closings in the neighborhood or area that actually matters to you.


You do not need to make a decision today.


Sometimes watching the right information for a little while makes the right decision much easier to see.

Search Post

Recent Post
Texas outline with upward and downward market arrows representing September 2026 North Texas real es
September 4, 2026
September 2026 North Texas market update for Collin, Denton and Grayson counties, with price-range trends, inventory, buyer activity and practical insights.
Outline of Texas with a rising arrow representing North Texas real estate market trends
August 3, 2026
See housing trends as of August 2026 by price range in Collin, Denton, and Grayson counties, with practical guidance for North Texas buyers and sellers.
Lake shoreline at sunset with nearby trees
July 14, 2026
Explore lakefront and lakeside towns near Lake Lavon, Lewisville Lake, and Lake Texoma, including lifestyle, public access, and buyer considerations.
Couple holding a home sign after buying their new house
July 1, 2026
Use the first 90 days of homeownership to organize warranties, repairs, utilities, and records that make maintenance and resale easier later.
Texas outline with upward and downward market arrows representing September 2026 North Texas real es
September 4, 2026
September 2026 North Texas market update for Collin, Denton and Grayson counties, with price-range trends, inventory, buyer activity and practical insights.
Outline of Texas with a rising arrow representing North Texas real estate market trends
August 3, 2026
See housing trends as of August 2026 by price range in Collin, Denton, and Grayson counties, with practical guidance for North Texas buyers and sellers.
Lake shoreline at sunset with nearby trees
July 14, 2026
Explore lakefront and lakeside towns near Lake Lavon, Lewisville Lake, and Lake Texoma, including lifestyle, public access, and buyer considerations.
Couple holding a home sign after buying their new house
July 1, 2026
Use the first 90 days of homeownership to organize warranties, repairs, utilities, and records that make maintenance and resale easier later.
Power lines crossing Texas property, showing an example of a utility easement
May 5, 2026
Understand Texas easements, utility access, surveys, title issues, and how property rights may affect buyers, sellers, and owners.
Aerial view of roof damage after a storm
April 27, 2026
Learn how North Texas storm damage may affect home insurance, roof condition, buyer concerns, seller prep, and real estate decisions.
More Posts