September 2026 North Texas Real Estate Market Update: Collin, Denton & Grayson Counties

September 4, 2026

Collin, Denton, and Grayson Counties by Price Range

Is the North Texas market slow? Strong? A buyer’s market? A seller’s market?

The more useful answer is: it depends on what you are buying or selling.


Across Collin, Denton, and Grayson counties, some price ranges are still showing healthy buyer activity while others have noticeably fewer homes going under contract. That matters because countywide averages can hide what is actually happening to a home in your price range.


This month, pending sales deserve particular attention. Closed sales tell us what happened with contracts negotiated several weeks ago. Pending sales give us a better look at what buyers are choosing now.


For sellers, fewer competing listings may sound encouraging—but what if buyer activity has fallen even faster? For buyers, more inventory may create opportunity—but is the home actually a good value once you consider condition, repairs, taxes, insurance, and monthly payment?


Those are the questions worth asking.


The charts below use the most recently published monthly MLS data available through North Texas Real Estate Information Systems, Inc. (NTREIS) as of September 4, 2026. Because September is still underway, the latest completed reporting month is August 2026.


The percentage beneath each number shows the year-over-year change, comparing August 2026 with August 2025. Keep in mind that an increase is not automatically good or bad. More listings may benefit buyers, while higher days on market or months of inventory may signal that sellers need to compete harder for attention.

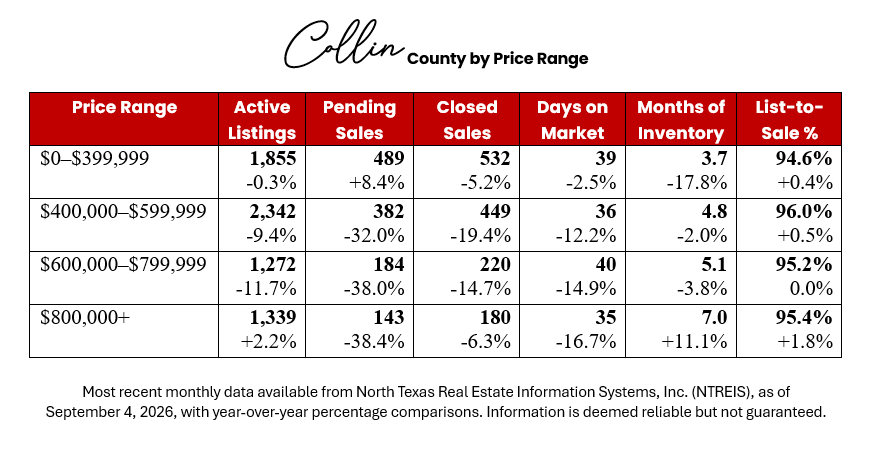
Homes Priced Under $400,000

This is currently the most encouraging price range for Collin County sellers.


Pending sales increased 8.4% from last year, active listings were essentially flat, and months of inventory dropped 17.8% to 3.7 months. In simple terms, buyers are still actively absorbing homes in this bracket.


But does that mean you can put any home under $400,000 on the market and expect multiple offers? No.


Closed sales were still down 5.2%, and the average list-to-sale percentage was 94.6%. Buyers may be active, but they are not ignoring condition, repairs, taxes, insurance, location, or the monthly payment simply because the home falls into a lower price range.


What to watch: Affordability can bring more buyers into the conversation, but value still has to make sense. Sellers should pay close attention to condition and competing homes. Buyers should look beyond the purchase price and ask what the home will realistically cost to own after closing.

Homes Priced from $400,000 to $599,999

Here is where the story begins to change.


Active listings are down 9.4%, which sounds positive for sellers at first. But pending sales fell 32.0%, and closed sales declined 19.4%.


So yes, there are fewer homes competing for buyers—but there are also considerably fewer buyers moving forward with purchases.


The homes that did sell moved faster, averaging 36 days on market. That may tell us something important: buyers are still acting when a home feels like the right combination of price, condition, and location.


What happens to the others? They may simply get passed over.


What to watch: If showings are slow, do not assume time alone will fix the problem. Ask a harder question: if you were the buyer, would your home be one of the best choices available at this price today?

Homes Priced from $600,000 to $799,999

This range has fewer homes for sale than it did a year ago, but buyer activity has dropped even more sharply.


Active listings declined 11.7%, while pending sales fell 38.0% and closed sales were down 14.7%.


At the same time, the homes that sold averaged 40 days on market, about 15% faster than last year.


That may sound contradictory, but it really is not. The market can become more selective without every successful sale taking longer. Buyers may be narrowing their choices quickly and acting on the properties they believe deserve the price.


What to watch: Sellers should be careful about pricing from the best comparable sale in the neighborhood without accounting for the differences. Was that home more updated? Did it have a better lot, layout, school assignment, or location? Buyers notice those differences, especially when they are making a larger financial commitment.

Homes Priced at $800,000 and Above

This is where Collin County begins to show more buyer leverage.


Active listings increased 2.2%, pending sales fell 38.4%, and months of inventory climbed to 7.0 months.


Interestingly, the homes that sold averaged only 35 days on market, considerably faster than last year.


So which number should sellers believe?


Both.


The right homes can still sell quickly, but buyers have more choices overall and fewer are entering contracts than they were a year ago.


What to watch: At this price point, buyers are not only comparing bedrooms and square footage. They are often comparing lot, privacy, architecture, updates, schools, neighborhood, commute, amenities, and new construction. If another home offers a more compelling package at a similar price, why would the buyer choose yours?

Collin County Market Update by Price Range
Denton County Market Update by Price Range
Homes Priced Under $400,000

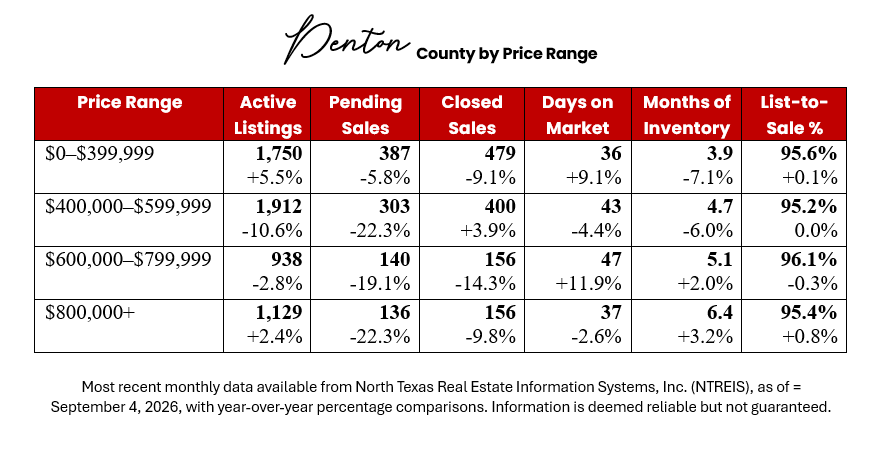
Denton County buyers have slightly more to choose from in this range, with active listings up 5.5%.


At the same time, pending sales declined 5.8%, closed sales fell 9.1%, and average days on market increased to 36 days.


Months of inventory, however, fell to 3.9 months.


That is a good example of why one statistic rarely tells the whole story. Inventory is still relatively contained, but buyers are moving somewhat more carefully than they were last year.


What to watch: A lower price range can attract more buyers, but those buyers may also be especially sensitive to monthly payment and immediate repair costs. A home needing a roof, HVAC, flooring, or other major work can quickly stop feeling affordable—even if the asking price looks attractive.

Homes Priced from $400,000 to $599,999

This is one of the more interesting Denton County price ranges this month.


Closed sales increased 3.9%, which sounds encouraging. But pending sales fell 22.3%.


Why does that matter?


Because the closed sales reflect contracts that were negotiated earlier. Pending sales give us a better glimpse of the buyers entering contracts now.


Active listings are also down 10.6%, meaning there are fewer homes available, but that alone has not been enough to keep current buyer activity from falling.


What to watch: Do not rely only on recent closed sales when deciding how to price a home. What is active today? What has gone pending recently? What has already reduced its price? Those listings may tell you more about today's buyer than a strong sale negotiated six or eight weeks ago.

Homes Priced from $600,000 to $799,999

This price range deserves a little more caution.


Pending sales declined 19.1%, closed sales fell 14.3%, and homes took longer to sell, averaging 47 days on market.


Months of inventory also increased slightly to 5.1 months.


The list-to-sale percentage remained relatively strong at 96.1%, but that number needs context.


Did the seller reduce the price before receiving the offer? Did they contribute toward closing costs? Pay for repairs? Buy down the interest rate?


Those concessions are not always obvious from the list-to-sale percentage alone.


What to watch: Sellers should look beyond the final sales price when evaluating comparable sales. Buyers are often negotiating the entire transaction, not just the number written on the first page of the contract.

Homes Priced at $800,000 and Above

Denton County's higher-end market continues to give buyers more room to compare.


Months of inventory increased to 6.4 months, pending sales declined 22.3%, and closed sales were down 9.8%.


The homes that sold averaged 37 days on market, slightly faster than last year.


Once again, that distinction matters. A market can have more inventory and fewer buyers while the strongest listings still sell relatively quickly.


What to watch: Sellers should not confuse another home's quick sale with proof that every home in the price range should move quickly. What made that property stand out? Better condition? Better lot? Stronger location? More competitive pricing? That is often where the useful lesson is hiding.

Grayson County Market Update by Price Range
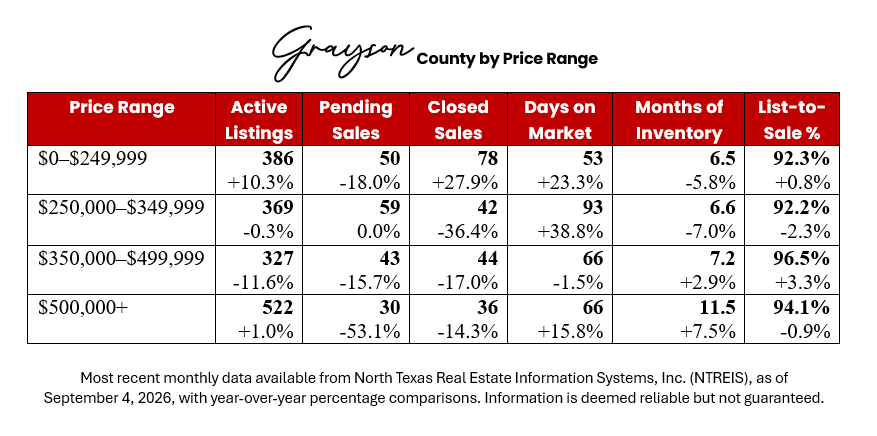
Homes Priced Under $250,000

Closed sales increased 27.9%, making this the only Grayson County price range with a substantial increase in completed sales.


But current activity deserves a closer look.


Pending sales fell 18.0%, while homes that sold took an average of 53 days, up more than 23% from last year.


Inventory remains at 6.5 months, and the average list-to-sale percentage was 92.3%.


So while buyers are clearly purchasing homes in this range, they do not appear to be accepting every asking price.


What to watch: Buyers should pay especially close attention to the cost of repairs and deferred maintenance. An inexpensive home is not necessarily inexpensive to own. Sellers should think about which issues a buyer can comfortably take on—and which may cause them to choose another property instead.

Homes Priced from $250,000 to $349,999

This is one of the price ranges where sellers should be especially thoughtful.


Closed sales declined 36.4%, while homes that sold spent an average of 93 days on market, up 38.8% from last year.


Pending sales were flat, inventory remained at 6.6 months, and the list-to-sale percentage fell to 92.2%.


Would pricing high to “leave room to negotiate” help in a market like this?


Possibly—but only if buyers engage in the first place.


If they believe there are better values nearby, they may never make an offer.


What to watch: The first few weeks on market matter. If buyers are looking but not scheduling showings—or showing but not making offers—pay attention to what that feedback is telling you. Waiting longer is not always the same thing as waiting for the right buyer.

Homes Priced from $350,000 to $499,999

There are fewer active listings in this range, with inventory down 11.6% from last year, but buyer activity also softened.


Pending sales declined 15.7%, closed sales fell 17.0%, and months of inventory increased slightly to 7.2 months.


The list-to-sale percentage improved significantly to 96.5%, the strongest of Grayson County's four price ranges.


That is encouraging, but it should not be read as proof that sellers have regained the upper hand.


Fewer transactions are occurring, and buyers still have more than seven months of inventory based on the recent sales pace.


What to watch: Pay attention to which homes are actually earning that stronger sale-to-list percentage. Are they updated? On acreage? Newer? Better located? The goal is not just to know the average—it is to understand what the successful listings had in common.

Homes Priced at $500,000 and Above

This is the price range where we would urge sellers to look at the numbers most carefully.


Pending sales dropped 53.1%, closed sales declined 14.3%, days on market increased to 66 days, and months of inventory climbed to 11.5 months.


That is nearly a year's worth of inventory based on the current pace of sales.


Does that mean a $500,000+ home in Grayson County cannot sell well? Absolutely not.


But it does mean buyers generally have time to compare—and higher-priced Grayson County homes are often difficult to compare using price per square foot alone.


Acreage, barns, shops, outbuildings, road access, utilities, septic systems, wells, construction quality, restrictions, and future development can create major differences between two homes that appear similar on paper.


What to watch: Sellers need to know what else a buyer can purchase for the same money. Buyers, meanwhile, may have negotiating room—but that should not replace careful due diligence. A rural property's value can depend just as much on what comes with the land as what is inside the house.

What the Three Counties Reveal Together

The September numbers reinforce something we say often: there is no single North Texas housing market.


Collin County's under-$400,000 range currently shows the clearest buyer activity, with pending sales increasing and inventory tightening. Move above $400,000, however, and pending sales fall sharply.


Denton County is more mixed. Some closed-sale numbers still look fairly healthy, but pending activity is lower in every price range. That is worth watching because today's pending contracts often give us a better indication of what the next round of closings may look like.


Grayson County shows the widest differences. Homes under $250,000 had considerably more closings than last year, while the $500,000+ range has 11.5 months of inventory and 53.1% fewer pending sales.


Same region. Very different markets.


There is another lesson in this month's numbers: days on market can be misleading when viewed by itself.


Several Collin County brackets had fewer pending sales but faster days on market.

How can both be true?


One possibility is that buyers are narrowing their choices. The homes that feel well priced, well maintained, and competitive are still selling efficiently. The homes that do not? They may simply remain available.


That is why we would not make a buying or selling decision based on a headline that says the market is “hot,” “slow,” or “balanced.”


The better question is:

How does this particular home compare with the choices buyers have right now?


That means looking at more than the county average.


What is happening in the neighborhood? At the same price point? With similar condition and upgrades? Are there competing new-construction homes offering incentives? Are buyers stretching their budget to reach this price range? What would they have to spend after closing?


Those details can change the answer considerably.


And remember, list-to-sale percentage does not tell you the entire negotiation. A home may sell relatively close to its final list price while the seller also contributes toward closing costs, repairs, a rate buydown, or other concessions.

If you are thinking about selling, we can give you an honest, property-specific look at your home—including where it is likely to compete well, where buyers may push back, and whether there are issues worth addressing before you put it on the market.


Not ready to make a move?


We can also set you up with a Neighborhood Market Watch so you can follow the homes that actually matter to you: new listings, price changes, pending sales, and recent closings in a specific neighborhood or area.


Sometimes the smartest move is not to act immediately. It is to watch the right information until the decision becomes clearer.


📞 Call or Text: (469) 499-7452
📧 Email:  cindycoggins@kw.com
See why so many clients trust us—check out our 5-star reviews on Google.

Search Post

Recent Post

Outline of Texas with a rising arrow representing North Texas real estate market trends
August 3, 2026
See housing trends as of August 2026 by price range in Collin, Denton, and Grayson counties, with practical guidance for North Texas buyers and sellers.
Lake shoreline at sunset with nearby trees
July 14, 2026
Explore lakefront and lakeside towns near Lake Lavon, Lewisville Lake, and Lake Texoma, including lifestyle, public access, and buyer considerations.
Couple holding a home sign after buying their new house
July 1, 2026
Use the first 90 days of homeownership to organize warranties, repairs, utilities, and records that make maintenance and resale easier later.
Power lines crossing Texas property, showing an example of a utility easement
May 5, 2026
Understand Texas easements, utility access, surveys, title issues, and how property rights may affect buyers, sellers, and owners.
Outline of Texas with a rising arrow representing North Texas real estate market trends
August 3, 2026
See housing trends as of August 2026 by price range in Collin, Denton, and Grayson counties, with practical guidance for North Texas buyers and sellers.
Lake shoreline at sunset with nearby trees
July 14, 2026
Explore lakefront and lakeside towns near Lake Lavon, Lewisville Lake, and Lake Texoma, including lifestyle, public access, and buyer considerations.
Couple holding a home sign after buying their new house
July 1, 2026
Use the first 90 days of homeownership to organize warranties, repairs, utilities, and records that make maintenance and resale easier later.
Power lines crossing Texas property, showing an example of a utility easement
May 5, 2026
Understand Texas easements, utility access, surveys, title issues, and how property rights may affect buyers, sellers, and owners.
Aerial view of roof damage after a storm
April 27, 2026
Learn how North Texas storm damage may affect home insurance, roof condition, buyer concerns, seller prep, and real estate decisions.
Home inspector checking a Texas house for roof, HVAC, plumbing, and foundation concerns
March 24, 2026
Learn what Texas home inspections reveal about roofs, HVAC, plumbing, electrical, windows, foundation, pests, and buyer decisions.
More Posts